
As I started to write this week's newsletter, I realized that polling and polarization take up quite a bit of space on their own, so I'll start there. Next week I'll get into the specifics on split ticket voting in Texas.
Full disclosure: much of this analysis is taken from Nate Silver at FiveThirtyEight and the analyst David Shor. My goal here is to try and condense their biggest points from the last five years into this newsletter.
Last warning - this is going to be a much longer newsletter and go into the "horse race" aspect of national politics. It's not my favorite and it's not really what this newsletter is designed to focus on. I'm more interested in policy and politics at the local level. But so much of politics today is nationalized that it's worth taking a high level view before getting a bit more granular.
If the length seems quite daunting, here's the long and short:
If you're reading this, you're probably either a college educated voter or a voter particularly interested in politics. Either way, you're a minority. Most people don't think like you and don't rank their values in the same way you do. Polling has quite a bit of error because people like you and me respond to surveys more often and, as it turns out, we're more Democratic leaning as a group, than the average voter. Pollsters are trying to find ways to compensate and talk to everyone, but they can only do so much. The best thing you can do to try and "make sense" of what's going on is to try and find people in your social circle who are "normal". They watch sports, listen to music, focus on their families and don't really follow politics. Talk to them, ask them what they think about the world and try really hard to listen. What they say probably won't make sense to you, but just remember, they're the normal one - you're the outlier.
In last week's newsletter, I explained how I set my expectations around the 2020 elections. To start, I assumed the 2018 results were the new "truth" and as the campaigns got going, I slowly "updated" how I thought about various races based on a variety of factors but by the end of the race, I mostly relied on the polls.
So we need to talk about polls. The polls this year were "ok", but not really great. Unfortunately, as Nate Silver from FiveThirtyEight notes, that's pretty normal. Let's get into it.
Polls - 2016 Edition
I won't rehash the whole question around polling from 2016. If you're interested in the real technical nitty gritty, I highly recommend this 12-part series by Nate Silver. But for the purposes of this discussion, I had two main takeaways from 2016:
1. While Hillary Clinton had, at various times, large leads over Donald Trump, her vote share (even after allocating undecided voters) was not consistently above 50%. In other words, there were large numbers of undecided voters. In the end, these undecided voters chose Trump. We can see that effect in the Michigan exit poll. Clinton and Trump tied among the 84% of voters that made a decision before the last week, but Trump won voters that made a choice in the last week by 11 pts!

2. In modern elections before 2016, if you were trying to guess which party a voter voted for, you'd rather know their income or if they were a union member than whether they went to college. Income and union membership were better predictors. In 2016, that changed and graduating college became a better flag. That's important because pollsters had been weighing their sample of likely voters by income levels and not college graduation.
This gets a little tricky, but let me try to explain. Before 2016, voters in households earning $60,000 that graduated from college voted similarly to voters that earned $60,000 that did not. So suppose that when pollsters called households in the $60,000 group, the only people that responded to the survey were those that had graduated college. That wouldn't be a problem because whether or not a person went to college didn't really make a difference in how people voted.
In 2016, that dynamic broke. Now if pollsters weren't talking to enough voters that hadn't attended college, they'd be under counting the support of one candidate (in this case, Trump).
This new pattern - education polarization, or voting based on whether a voter went to college - was particularly important among White Americans. And as it turns out, White Americans who haven't gone to college were especially concentrated in Midwest states like Michigan, Wisconsin and Pennsylvania and ended up swinging for Trump.
These two factors (a large number of undecideds and under counting non-college graduates) meant that Clinton's position wasn't nearly as secure as folks thought it was. I remember the New York Times and others claiming that Trump had anywhere from a 1 in 6 to 1 in 100 chance of winning. FiveThirtyEight gave Trump the best odds (3 in 10) or nearly double the next highest forecaster. And they only did so because their model caught the high undecideds problem.
Ok, so what does this mean for 2020?
Polls - 2020 Edition
In 2020, pollsters (and analysts) took these lessons to heart. If you were reading the coverage, you'd notice that journalists were watching closely to see whether Joe Biden would reach the magic 50% mark in polling averages. For example, it was early June when Biden's polling average in Michigan first hit 50%. He basically continued at that level through the rest of the election. The same dynamic occurred in Wisconsin starting around the end of June. As the election wound down and Biden held his ground at 50% mark (suggesting voters weren't changing their minds), Trump's odds of winning these states (and the Electoral College) declined.
Separately, journalists, pollsters, and everyone else following politics took this education polarization to heart (sort of - I'll come back to this) and began aggressively polling White Americans that hadn't gone to college. It was such a big deal that journalists started examining their own obsession with interviewing Trump voters in diners.
The first test for whether pollsters had figured out how to properly weigh for the education divide was in 2018 and they did reasonably well. The below table averages the polling errors and you can see that 2017-2019's numbers are below average for the period since 1998.
You might also notice below that the 2016 Presidential errors, while higher than average, were also not that much higher.

Given these results, I thought pollsters had resolved the education question. As it turns out, there were still some quite big polling misses. The below chart shows the polling errors in the Presidential race as of November 11.

The biggest miss looks like Florida where pollsters had Biden up 3 and he ended up losing by 3. North Carolina was the other swing state that pollsters called incorrectly. It'll take some time to digest exactly what happened, but pollsters probably under weighted voters who didn't go to college.
Now certainly some folks are wondering when I'm going to talk about the swings in support among African Americans and Latin Americans towards Trump. Those are real, but they actually relate to the education divide I've been describing all along.
Education Polarization
The best analyst I've read on this topic is by David Shor and if you want to get into the nitty gritty, check out his 2020 postmortem. The basic idea is that polarizing around college graduation isn't just for White Americans, it affects everyone.
Now before I go further, I want to be really explicit: I am not saying that "dumb people" are the only ones voting for the Republicans. First, just because a person graduated from college doesn't make them smart. And second, as many college graduates can confirm, the college experience is as much about the experience itself as it is about what one might learn. Folks who go to college often talk a certain way, walk a certain way, and evaluate and solve problems a certain way. These are cultural differences among different classes.
(For a great discussion on the culture of class, check out this great Ezra Klein show interview with Michael Lind from the LBJ School of Public Policy at The University of Texas at Austin)
Over time, Democrats have been picking up more voters from the college cultural group and Republicans have been picking up more voters from the non-college cultural group. This is a bit of a challenge for Democrats because while college voters tend to vote at higher rates (e.g. they have flexible schedules and can take time off to vote, they follow the news and are more familiar with the candidates so the decisions are easier to make, etc), they are also a minority in the country. Nationally, just about 30% of folks aged 25 years and older have at least a Bachelor's degree. On the other end, over 40% of those aged 25 years and older have a high school degree at most.

The gaps get even more distinct at the state level (which is important for the Electoral College). 19 states have a proportion of college graduates greater than the national average. The state with the highest proportion of college graduates is Massachusetts, and they cap out at 41% - not even a majority.
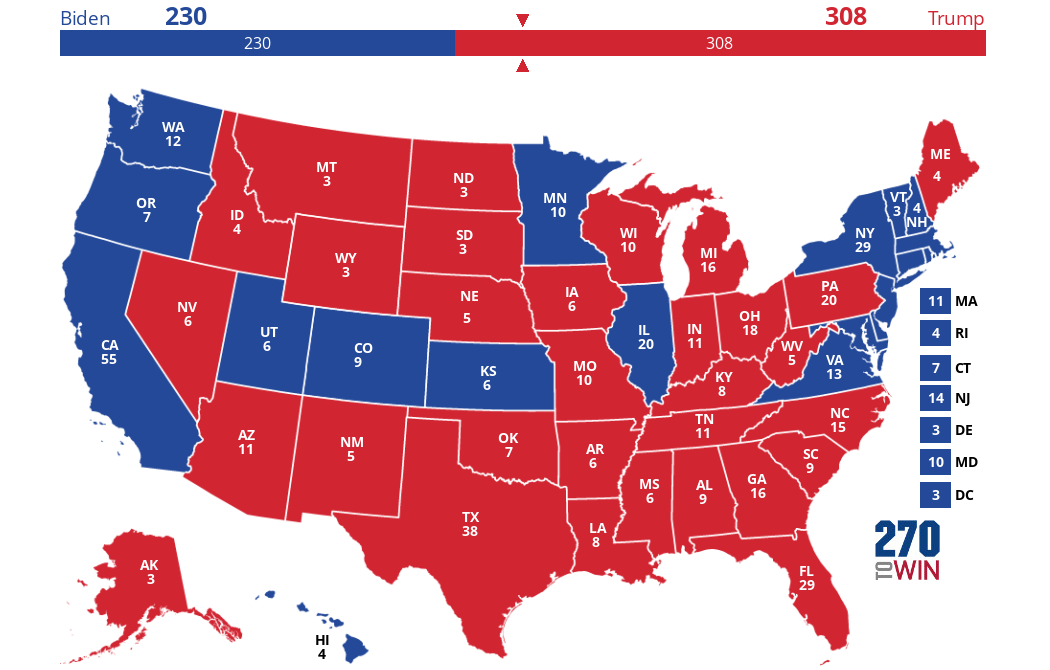
Here's another way to look at it. Suppose Joe Biden only won the states with a higher than average proportion of college graduates. This would be his map.
 Click the map to create your own at
 As you can see, it's basically the Clinton 2016 map (swapping out Kansas and Utah for Nevada and New Mexico and splitting Maine 3-1 for Clinton). Remember, that's also only 19 states (plus DC). If states don't split their tickets for Senators (as is now the norm), Democrats would win 38 Senators out of 100. That's not enough to hold a filibuster, let alone command a majority.
Now Democrats end up being more competitive in places like Nevada, New Mexico, North Carolina, Florida, Georgia and Arizona because traditionally African American, Latin Americans and Asian Americans are more likely to support Democrats than their college graduation proportions would suggest. Answering why is a question for a different letter.
However, over the last 30 years college graduation has become incredibly important in determining a person's quality of life (job, housing, marriageability), especially for ethnic minorities. It's not surprising then that eventually these groups would also polarize by education. Though early (and somewhat unreliable due to the massive early/absentee vote) exit polls suggest that most voters of color still voted for Biden, but his margins were tighter than Clinton's margins. That made a difference in Florida and probably made a difference in North Carolina.
The flip side of education polarization means that at this stage of the transition, a Democrat like Joe Biden can squeak a win in Arizona and Georgia by getting more college graduate White Americans and still winning enough Latin Americans and African Americans, respectively.
In conclusion, part of the polling error is almost surely that pollsters did not properly poll non college graduates from all backgrounds, not just White Americans.
Now while that might explain Florida, it doesn't explain the miss in Wisconsin - a state with fewer Latin Americans and African Americans.
Trust
The last part of the polling problem contains two parts. One that's (hopefully) unlikely to repeat itself, and the other that's depressingly hard to solve.
First the easy part: if you read the David Shor piece, he points out that you can start to see Biden's polling numbers improve at the beginning of the stay at home orders. Remember I said Biden's numbers started to improve in June?
Because more people were at home, more folks were available to participate in surveys. But remember, the trick is pollsters need a representative sample. Pollsters recognized that Democrats and Biden supporters were more likely to stay home, so when they released their surveys, they made sure to reweight the poll to make sure and represent Trump voters. The problem is that they were talking to the wrong type of Trump voter. Specifically, pollsters were talking to the type of Trump voter who really took the stay at home order seriously. And those Trump voters were much more likely to vote for Biden than Trump voters who weren't at home taking the stay at home orders seriously.
In that sense, pollsters overestimated the number of unsatisfied voters and overestimated Biden's support. You can read some great preliminary analysis that supports this theory by Brian Stryker over at Medium.
The good news is that (hopefully) we're unlikely to repeat that mistake.
Unfortunately, another effect we can't rule out is that, with polling response rates declining, the people who answer polls are just incredibly different than those that don't. When polling first began, nearly everyone would respond. Nowadays, polling response rates are in the low single digits. That means the people that answer polls are probably really different from everyone else.

In what way are they different? Well, Shor suggests that poll respondents are more likely to have high social trust, or they mostly believe in institutions like government, science, the arts, the business sector, etc, and less likely to believe in conspiracy theories than the average voter. Remember, if pollsters don't properly count everyone that votes, including conspiracy theorists, the polls will be wrong.
This theory is still being evaluated. But if it's true, it portends for larger problems in polling going forward.
I know this was quite long, but I promise it will make sense once I talk about polling and split ticket voting in Texas next week.
Again, please send any and all feedback to [email protected].